Inventory marking issue in Axapta 3.0

There’s a problem when modifying marked transactions. It’s possible to end up with a transaction that is not reserved but has a reference lot ID anyway, i.e. is marked to another transaction. This can lead to hard to explain problems down the line, e.g. after running the master planning planned orders are missing or incorrectly matched to outgoing transactions.

Scenario

There is an easy way to trigger this. Create a sales order for an item. Then create a linked purchase order for the amount sold. This marks both inventory transactions to each other. The inventory transaction for the sales line issue is in status reserved ordered and contains the reference lot ID of the purchase order line.

Now increase the quantity on the sales line. This creates a second inventory transaction for the new quantity in issue status on order and with the same reference lot ID. This means the new quantity is also marked to the same purchase order. This is obviously not correct.

Marking implies reserved transactions (physically or ordered) and the quantities on both sides should match. In this case the purchase order is not sufficient for the quantity sold. That’s why the new transaction is put in status on order in the first place. Unfortunately the marking is not fixed.

Something similar happens when you increase the purchase quantity instead of the sales quantity.

Fix

This behavior is fixed in Dynamics Ax 4.0 SP1. And the good news is it can be backported. The bug resides in InventUpd_Estimated.createEstimatedInventTrans(). This is where a new InventTrans record is created for the added quantity. It correctly determines the issue status and then stops. In 4.0 the marking is checked there as well.

The end of the method looks like this:

if (movement_Orig)
    inventTrans.updateSumUp();
 
updEstimated += qty;

Replace it with this:

updEstimated += qty;
 
// Fix 4.0 SP1 >>
if (movement.inventRefTransId()) // Marking for entire lotId exists => additional should also be marked
{
    markNow = InventTrans::updateMarking(movement.inventRefTransId(), movement.transId(), -qty,  '', SortOrder::Descending);
 
    if (markNow)
    {
        if(abs(markNow)  0 ? abs(markNow) : - abs(markNow));
 
        inventTrans.InventRefTransId =  movement.inventRefTransId();
        inventTrans.update();
 
        InventTrans::findTransId(inventTrans.InventRefTransId, true).updateSumUp();
    }
    if (qty < 0) // issue
    {
        InventUpd_Reservation::updateReserveRefTransId(movement);   // try to make reservation according to marking -
    }
    else
    {
        inventTransMovement = InventTrans::findTransId(movement.inventRefTransId());
 
        if(inventTransMovement)
        {
            movementIssue = inventTransMovement.inventMovement(true);  // no Throw if not initiated
 
            if(movementIssue)
                InventUpd_Reservation::updateReserveRefTransId(movementIssue);  // try to make reservation according to marking -
        }
    }
    if (!markNow &amp;&amp; inventTrans.InventRefTransId) // reset InventRefTransId if no marking could be made
    {
        inventTrans.InventRefTransId = &#039;&#039;;
        inventTrans.update();
    }
}
// <<
 
if (movement_Orig)
    inventTrans.updateSumUp();

You’ll also need to add these variables at the top:

InventQty           markNow;
InventMovement      movementIssue;
InventTrans         inventTransMovement;

Final remarks

I could reproduce this on a standard 3.0 SP5 installation. I was a bit surprised to see that this has gone unnoticed for so long. However it is a subtle bug that is hard to spot. The transaction status is correct and the effects of marking aren’t immediately visible.

This kind of inconsistency can really mess up the InventTrans table. Without the fix try, increasing the purchase quantity and then on the sales order remove the inventory marking completely. You end up with several inventory transactions for the purchase order. Some of which are still marked to the sales order.
10 tips for debugging in Dynamics Ax

Fixing bugs requires quite a bit of experience and knowledge of the modules involved, both on a technical and functional level. The first step to fix something is to find the cause of the problem, a.k.a. debugging.

You shouldn’t limit yourself to using the debugger when things go wrong. Debugging can help you understand the system. I often fire up the debugger just to see what happens in a standard application. This helps me to see how modifications can be implemented and what the consequences are. Dynamics is too big and too complex to be able to just dive in and change something.

Here are some tips to help you in the fine art of debugging. Some might be blatantly obvious to experienced developers. These are things I wish I had known when I first started working with Axapta.

Assume you broke it
This is probably the most important advice. We developers tend to think we write good code. Some of us do, some of us don’t. But nobody does it flawlessly. By default, assume anything you didn’t write yourself works perfectly. This narrows down the search considerably. After careful debugging you may come to a different conclusion. In which case you’ll have a good bug report to file.

If a system has been running fine for a while and it suddenly breaks down after importing new code, those changes are likely to be the root cause of the problem. Try reverting your changes and doing the exact same thing. If the problem remains, you have found an unrelated problem. If not, you know where to start looking for errors.

Get a clear description of the problem
Unless the error is clear enough and you immediately know how to fix it, you’ll need a detailed description how to trigger this error. Unfortunately this can be very hard. Getting users to tell you exactly what you need to understand a bug isn’t that simple. Keep in mind that users are generally not interested in the program they’re using. They just want to get their job done. They have been taught to use the system in a certain way and unexpected errors confuse them. They might not realize what’s different when things go wrong compared to when everything just works.

You need to ask the right questions. If necessary sit next to them and watch them work. Take notes and try to notice special cases. And don’t forget to ask what the correct behaviour should be. There may be no error message and whatever happens may look correct but the user could be expecting a different result.

Without a good scenario it may be impossible to solve some bugs.

Don’t worry to much about errors that only occur once
If something goes wrong only once and it doesn’t happen again, don’t worry too much about it. Depending on the risk it may be better to fix the damage and move on. There’s probably a bug lurking somewhere but you have to decide if it’s worth chasing it.

Intercept error messages
Anything sent to the info log window passes through the add() method on the Info class. Put a breakpoint there if you want to know where a message is triggered. Using the stack trace in the debugger it’s usually not that hard to see which conditions cause it.

Often it turns out to be a missing setting in one of the basic tables.

Intercept data modifications
Not all bugs come with an easy to intercept error message. Sometimes all you get is bad data. It’s possible to see when and why records are created, modified or deleted by putting breakpoints in insert(), update() or delete() on a table. Create them if necessary. Just being able to look at the stack in the debugger when these are called can be very insightful.

Remember that it is possible to modify data without passing through these methods. Like using doInsert(), doUpdate() or doDelete(), or using direct SQL. It’s not very common but sometimes you can miss something.

Intercept queries
If you suspect a query is not correct you’ll want to verify its output. A way that doesn’t require much work is using the postLoad() method. It can be overridden on each table and is called for each selected record. It even works with complex joins. Putting an info() in the postLoad() of each table in a query can tell you a lot about what’s happening.

The cross-reference is your friend
The cross-reference is one of the most important tools when developing and debugging in Dynamics Ax. Always try to have an environment somewhere with an updated cross-reference (not the live environment). You can find the cross-reference in the development tools menu.

Need to know where a field gets its value? The cross-reference tells you where every read and write happens.
Want to know where an error message is used? Open the label editor and find the label, then click the Used By button.

Set up a separate environment
When dealing with complex problems it helps to have a separate environment for debugging. This allows you to freely modify code and data without affecting the live system. This is very important when you have to post invoices or do anything else that is basically irreversible.

It also prevents live users from being blocked if you have breakpoints in the middle of a transaction.

Dealing with large datasets
Sometimes a problem can only be reproduced in (a copy of) the live environment. You’re often stuck with a lot of data that doesn’t matter but gets in the way. Like when you need to debug the MRP. Using regular breakpoints doesn’t help because it takes too long before you get to the real issue.

In this case you need to have some more tricks up your sleeve to narrow down the search. One option is to work in several passes. Using the cross-reference determine places where something interesting happens and dump data with info() or Debug::printDebug(). This should narrow down the possible suspects. With a bit of luck just looking at the data can be enough to identify the problem.

Another way is implementing your own conditional breakpoints. The debugger doesn’t offer these out of the box but you can roll your own with an if-statement and the breakpoint statement. This is very effective if you have some more or less unique identifier of the problem, like a record ID or a customer account or even a date.

Clean up
Don’t forget to remove any modifications you made while debugging. You probably don’t want to leave a hardcoded breakpoint in a live system. Been there, done that, very annoying.

Good luck hunting for bugs.

Feel free to share your debugging techniques.

Reflection with the Dictionary

In X++ it is possible to write code that inspects the structure of other X++ code. This is sometimes called reflection or meta-programming.

You may wonder why you’d want to do that. Reflection is a very powerful tool and opens a wide array of possibilities. Without it some things would be very hard or even impossible to implement. Just look at the code behind table browser, the unit testing framework, or the data export and import tools.

There are several ways to do reflection in X++. I’m going to show an example using the Dictionary. It involves classes whose names start with Dict and SysDict. The latter are subclasses of their respective Dict-class and can be found in the AOT.

The goal

Suppose you need to analyze the performance of an existing application. You could set up monitoring but you need an indication where to start. The largest tables in the database, i.e. those with most records, are potential performance bottlenecks. For large tables it is important to have the right indexes that match the usage pattern of the customer. We’re going to make a simple tool to find those tables. You could also check if new tables from customizations have indexes and so on.

Getting started

First we need to get a list of tables in the application. The kernel class Dictionary has the information we need. It tells us which classes, tables and other objects are defined in the application. To iterate over the list of tables we can use something like this:


static void findLargeTables(Args _args)
{
    Dictionary      dictionary;
    TableId         tableId;
    ;

    dictionary = new Dictionary();

    tableId = dictionary.tableNext(0);

    while (tableId)
    {
        info(int2str(tableId));

        tableId = dictionary.tableNext(tableId);
    }
}

The tableNext() method gives the ID of the table following the given ID. So we start with the non-existant table ID 0 and get back the first table in the system. For now we’ll just print the result to the infolog.

Weeding out the junk

If you scroll through the infolog you’ll notice it also includes things we aren’t interested in, such as temporary tables, (hidden) system tables, views, and table maps. We need to skip these.

Enter the SysDictTable class. Whenever possible you should use the SysDict version of any class in the Dictionary API because they contain very useful additional methods. You’ll see an example in a minute.


static void findLargeTables(Args _args)
{
    Dictionary      dictionary;
    TableId         tableId;

    SysDictTable    dictTable;
    ;

    dictionary = new Dictionary();

    tableId = dictionary.tableNext(0);

    while (tableId)
    {  
        dictTable = new SysDictTable(tableId);

        if (!dictTable.isMap() && !dictTable.isView() &&
            !dictTable.isSystemTable() && dictTable.dataPrCompany())
        {
            info(strFmt('%1 - %2', tableId, tableId2Name(tableId)));
        }

        tableId = dictionary.tableNext(tableId);
    }
}

Some methods tell us what kind of table we’re dealing with and any special case is ignored. For this example I’m only interested in a single company.

Counting

Now need to know which tables have the most records. SysDictTable can count the records for us. To keep track of the results we’ll use an array. The index indicates the number of records and the value is a container of table names. This is a simple data structure that doesn’t require any new tables or classes. The results are ordered and it can deal with several tables having the same record count. The only catch is we need to keep in mind that not all array indexes will have a value.

It’s easier than it sounds. First we take out the info() in the loop and put in some real logic.


        if (!dictTable.isMap() && !dictTable.isView() &&
            !dictTable.isSystemTable() && dictTable.dataPrCompany())
        {
            currCount = dictTable.recordCount();
            if (currCount > 0)
            {
                if (recordCounts.exists(currCount))
                {
                    tables  = recordCounts.value(currCount);
                    tables += dictTable.name();
                }
                else
                {
                    tables = [dictTable.name()];
                }

                recordCounts.value(currCount, tables);
            }
        }

We ignore empty tables and then check if we need to add our table to an existing container or create a new one.

After inspecting the tables we can print the top 10.


    printed = 0;
    i = recordCounts.lastIndex();
    while (i > 0 && printed  0 )
    {
        if (recordCounts.exists(i)
          && conLen(recordCounts.value(i)) > 0)
        {
            info(strFmt("%1 - %2", i, con2str(recordCounts.value(i))));
            ++printed;
        }
        --i;
    }

What’s next?

To make it more useful you could add more checks. I included some of these in the XPO.

  • cacheLookup() : to check if a good cache level is set.
  • indexCnt(), clusterIndex() and primaryIndex() : if you want to know if the table has indexes. For large tables a good set of indexes can make a big difference.
  • tableGroup() : for filtering out transaction tables, which are often the ones that need most tuning. Or to find all those Miscellaneous tables that should be in another group.
  • fieldCnt() : counts the number of fields. Tables with a lot of fields take up more space and require more round trips between AOS and database when fetching data. So don’t go overboard when adding new fields. It’s a good idea to check the field count every now and then when developing.
  • recordSize() : tells you how big a single record is in bytes. This depends on the number of fields and the data types.

There’s a lot more you can do with the Dictionary classes. To get an idea of the possibilities you can check how dictionary classes are used in the standard application.

In later posts I’ll give more examples how to read (and modify) the AOT structure in X++.
XPO for Dynamics Ax 4.0.

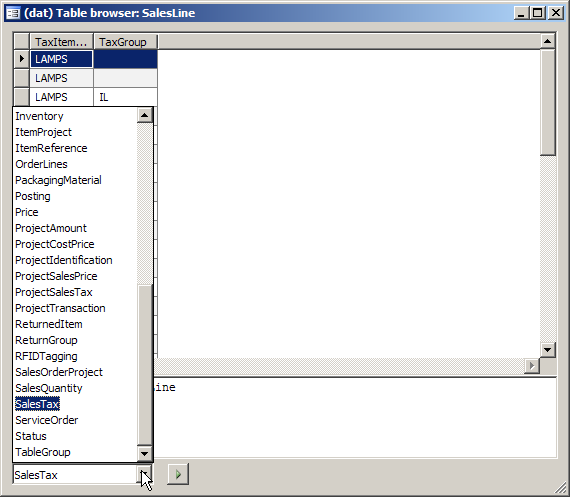
Table browser with field groups

The table browser is a great tool but it can be hard to find the fields you’re looking for in the grid. Standard Ax either shows all fields or the fields in the AutoReport field group.

Sometimes I like to use another field group so I added that option to the table browser. Now I can use any field group defined on the table. Filtering out the irrelevant fields makes browsing the data a lot easier.

Table browser screenshot

It wasn’t too hard to implement. Standard Ax code can already handle any field group but there is no way to choose one. On the form SysTableBrowser I replaced the radio button with a combobox and then modified the class SysTableBrowser to use that instead of the radio button.

XPO for Dynamics Ax 4.0

Languages in 3-tier

Today I noticed several labels were missing in a customer’s application. After some investigation it turned out I had accidently logged in using a language they don’t have a license for.

I dug a little deeper and discovered that when using a 3-tier configuration I could choose any language. The AOS can be configured with any language as well. When switching to 2-tier Axapta displayed the expected error about unlicensed languages.

This was a 3.0 SP1 setup, perhaps it’s fixed in later versions.

Axapta error handling and database transactions

Exception handling in Axapta is a bit weird. Unlike C# or Java, exceptions aren’t full classes. In Axapta exceptions are defined in the enum Exception and that’s it. You can’t create your own exceptions and you can’t add data to the exception. If you want the error message you have to get it from the infolog. It’s limited but it usually doesn’t get in the way. Unless you add transactions to the mix.

The catch (no pun intended) is that the throw statement in Axapta also does an implicit ttsAbort if you’re in a transaction. And that’s where the confusion starts and computers get yelled at.

Suppose you’re doing some updates to several tables and need to stop processing when you detect an error. The simplified code would be something like this:

static void TryCatchOutsideTTS(Args _args)
{
    ;
 
    try
    {
        ttsBegin;
 
        // ...
        throw error('Catch me if you can');
        // ...
 
        ttsCommit;
    }
    catch (Exception::Error)
    {
        info('Gotcha');
    }
 
    info('EOF');
}

When you run this everything works as you’d expect:
exception1.PNG

So far so good. Now what about catching exceptions inside a transaction? A possible scenario is a loop to update records, logging errors and continuing with the next record when an error is encountered. The code boils down to:

static void TryCatchInTTS(Args _args)
{
    ;
 
    ttsBegin;
 
    //while select forUpdate ...
    try
    {
        // ...
        throw error('Catch me if you can');
        // ...
    }
    catch (Exception::Error)
    {
        info('Gotcha');
    }
 
    ttsCommit;
 
    info('EOF');
}

And this is what you get:

That’s strange. The catch block was not executed at all. Even worse, the part after the try/catch is ignored as well and the method ends immediately.

If you’re using a try/catch construct, you probably need to clean up whatever you’re doing if things go wrong. This shows there is no guarantee the catch block will be executed.

What if we add another try/catch?

static void DoubleTryCatch(Args _args)
{
    ;
 
    try
    {
        ttsBegin;
 
        //while select forUpdate ...
        try
        {
            // ...
            throw error('Catch me if you can');
            // ...
        }
        catch (Exception::Error)
        {
            info('Gotcha');
        }
 
        ttsCommit;
 
        info('What about me?');
    }
    catch (Exception::Error)
    {
        info('None shall pass');
    }
 
    info('EOF');
}

Which yields:
exception3.PNG

This behaviour surprised me at first but then I realized it’s the same as throwing a new exception inside a catch block. The ttsAbort makes it impossible to execute the rest of the transaction safely, even if part of it is outside the try/catch block. So the only option is to fall back to a higher catch block.

Usually this doesn’t matter. In some cases this can get in the way. Like when you’re using resources (open files, connections, …) you really should release when you’re done. Using resources in a transaction isn’t best practice but you could end up in that situation without realizing it. Whenever you reuse code, be it a standard API or a third party module, it could do things you’re not fully aware of.

There’s no simple solution to the problem. Just be careful and test thoroughly to make sure situations like this can’t bring down a production environment.